Are you seeking for infographic submission sites that have been domainially infographics? If you are, then you have come to the right place.
Here’s everything you need to know about it. Let’s get started!
Table of Article Contents
ToggleWhat is Infographic Submission?
Infographic submission strategically shares visually compelling and informative graphics, such as charts or diagrams, on specialized online platforms.
In search engine optimization terms, it’s an SEO offpage practice employed to share graphical representations of information, data, or facts in the form of images.
The function of these hubs is showing people more pictures and make them known by incorporating visual means in storytelling.
It’s about distilling complex information into an interesting format that would attract audience and encourage them to share the content on social networks.
In simple terms, the process refers to submitting nicely drawn information graphics, targeted for regions intended to accommodate and enhance visual information.
These platforms differ from general content-sharing sites to specialized infographic directories and social media channels that correspond to the concept of visual content.
The Significance of Infographics in SEO
There are various reasons why infographics are very important for SEO.
They are interesting visual expressions of data, knowledge, or thoughts that convey difficult messages effectively.
Below is a detailed exploration which clears why infographics are important in SEO:
Visual Appeal and User Engagement:
Infographics capture users’ attention with their visual appeal. In an era of short attention spans, their dynamic nature facilitates quick absorption and understanding of information.
This heightened engagement contributes to longer on-page times, sending positive signals to search engines.
Backlink Generation:
Widely shared, high-quality infographics can generate valuable backlinks when other websites link to them.
For instance, creating an infographic on the latest digital marketing trends that gains traction among industry influencers or gets featured in reputable articles can signal to search engines the authoritative nature of your content.
Content Shareability:
Infographics are particularly popular in social media platforms as they help boost brand’s visibility as well as attract organic traffic.
For instance, imagine a travel agency designs an infographic that features most preferred holiday destinations for the coming year.
The users find it worth sharing leading to wide spread sharing in social media sites thereby increasing the presence of the entity on online channels.
Enhanced Readability and Comprehension:
To simplify complex information, infographics present visual elements that are easily understood by users.
For instance, a technology company may use an infographic when explaining complicated software architecture so that everybody including those without technical knowledge can understand.
Diversification of Content:
Having include infographics in your content strategy adds variety, which search engines appreciate.
Infographics provide a diversion from conventional text-based contents leading to a more interactive and all-round web presence.
For example, a fitness blog can make visual compositions showing distinct types of exercises for certain muscles.
Let’s explore some best infographic submission sites!
Top 10 Infographic Submission Sites to Use in 2025
Carefully select and use these best infographic submission platforms that match your audience and writing strategy and so they get seen and have an effect in various online places.
1. Slideshare.net
Website - https://www.slideshare.net/
Domain Authority - 95
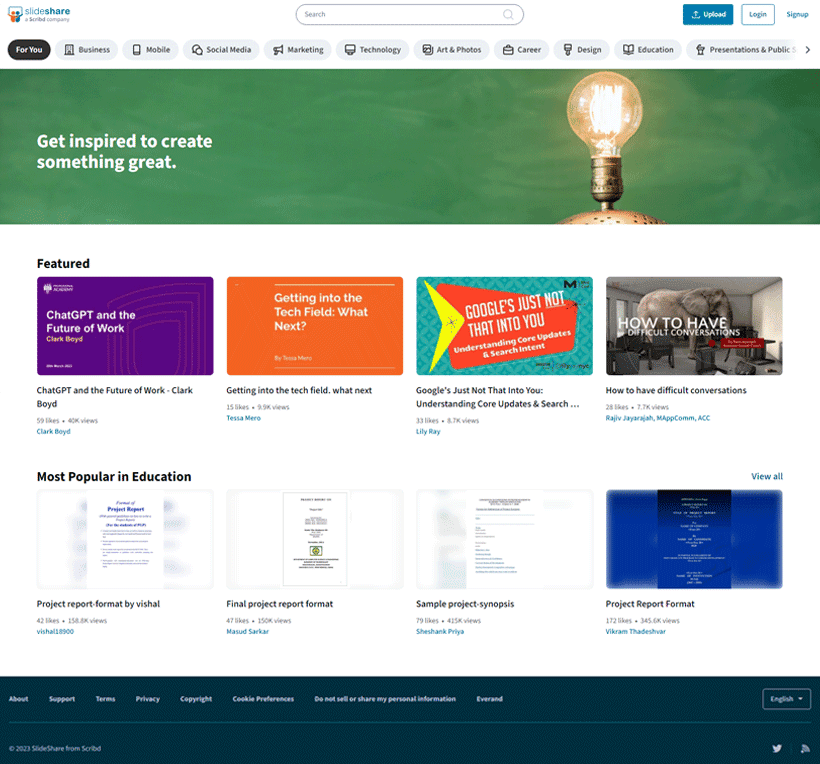
A premier platform for sharing presentations, Slideshare.net remains ideal for infographics, while it also serves as an integral part of the LinkedIn family.
With its vast professional network and intuitive interface known to many people, this site gives content creators an opportunity to deliver visually compelling and informational materials to a wide audience.
2. Pinterest

Website - https://www.pinterest.com/
Domain Authority - 94
Pinterest, a dynamic visual discovery and bookmarking platform, highlights visual content which is its main strength.
There is a seamless integration of infographics into this website as users actively seek visually appealing and informative content there.
This platform’s different users make it possible to reach many different niches extensively.
3. Flickr

Website - https://www.flickr.com/
Domain Authority - 92
A venerable photo-sharing platform, Flickr presents unique space for picture messages due to its importance on visual storytelling which concurs with infographic format.
Content creators leverage Flickr to share creative and captivating infographics, reaching a community with a profound appreciation for visually striking content.
4. Dribbble

Website - https://www.dribbble.com/
Domain Authority - 92
Dribbble that serves as showcase platform for creative professionals which is design oriented is of help to the graphic designers that concentrate on infographs.
By posting their work on Dribbble, the designers can not only show it to everyone but they can also get valuable community suggestions that enhances collaboration in design sector.
5. Reddit

Website - https://www.reddit.com/
Domain Authority - 92
Reddit, a diverse and dynamic platform comprising numerous communities or subreddits, hosts specific spaces dedicated to sharing infographics.
This targeted approach allows for engaging with diverse audiences, each with unique interests. Submitting infographics to relevant subreddits ensures precise interaction.
6. Visual.ly
Website - https://www.visual.ly/
Domain Authority - 86
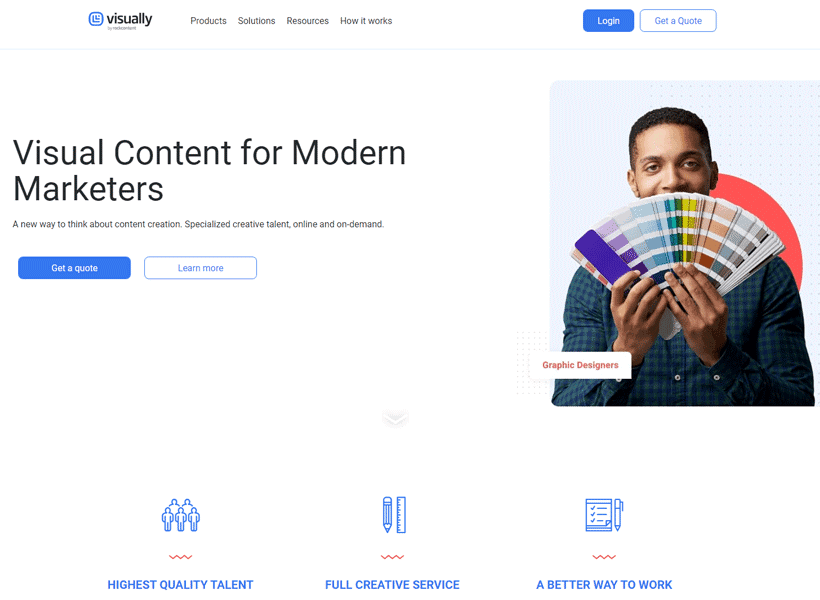
Visual.ly, a platform for creating infographics and other data visualizations in a way that is easy to use and understand, brings together people who are interested in exploring and exchanging top-notch visual content.
Content participants find Visual.ly to be an efficient tool for getting across to audiences that are in quest of striking infographics.
7. Instagram
Website - https://www.instagram.com/
Domain Authority - 94
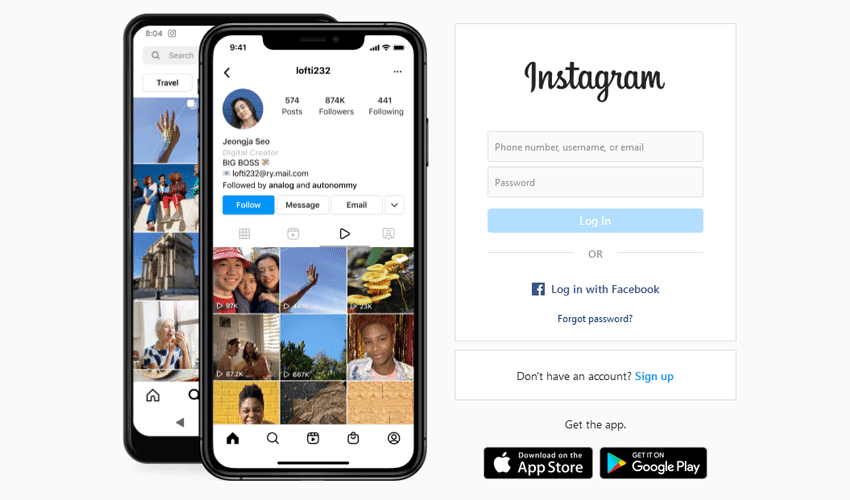
Instagram’s platform per excellence for sharing infographics is visually inclined. Through carousels, stories among others, engagement opportunities are brought to a notch higher.
Using Instagram enables graphic designers to reach out to a viewer intrigued by beautiful things using beautiful ways of presenting things.
8. LinkedIn

Website - https://www.linkedin.com/
Domain Authority - 99
LinkedIn, a platform designed for networking purposes that are considered professional, has become such a space based on discourse on infographics.
An infographic speaks louder than a thousand words. This is the old aphorism.
9. Daily Infographic
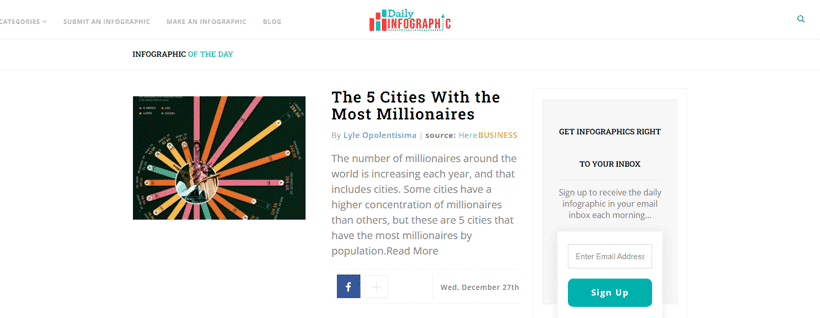
Website - https://www.dailyinfographic.com/
Domain Authority - 79
Daily Infographic, a niche platform exclusively focused on infographics, guarantees visibility among an audience actively seeking daily doses of visually engaging and informative material.
This targeted approach positions content creators for increased exposure within the infographic community.
10. Cool Infographics
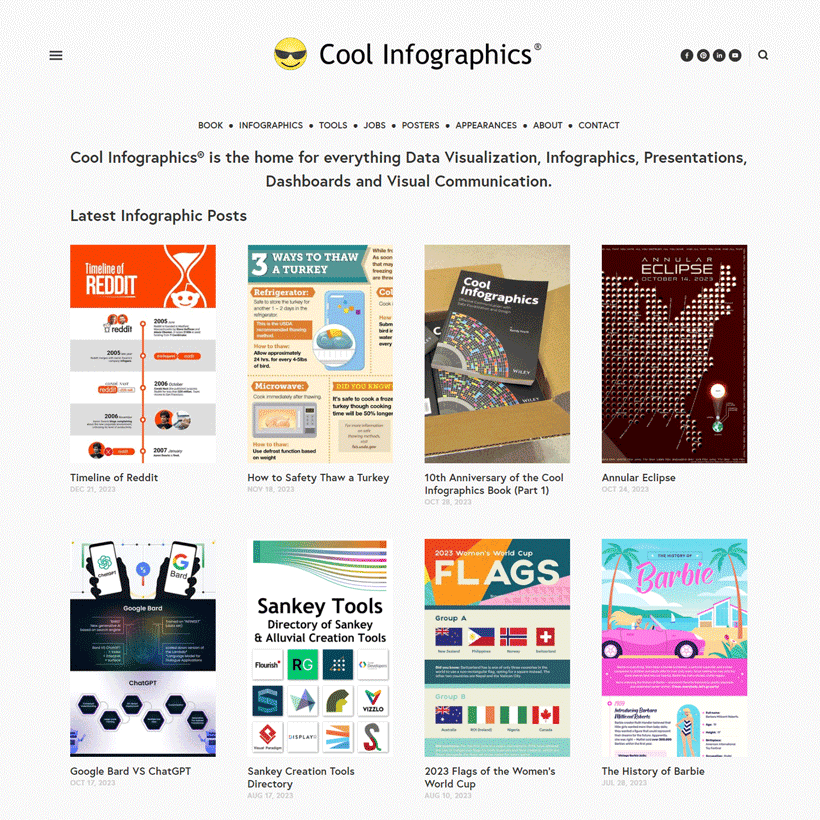
Website - https://www.coolinfographics.com/
Domain Authority - 60
Cool Infographics is a curated platform containing visually appealing and innovative infographics, and it provides an amazing spot for sharing some unique and well-designed visual content.
When featured on Cool Infographics, content gets to be discovered by the audience with the eyes for creativity and design.
High DA Infographic Submission Sites
| S. No. | High DA Infographic Submission Websites | Website DA |
|---|---|---|
| 1 | https://www.myspace.com/ | 95 |
| 2 | https://www.twitter.com/ | 94 |
| 3 | https://www.livejournal.com/ | 93 |
| 4 | https://www.justpaste.it/ | 91 |
| 5 | https://www.mobypicture.com/ | 82 |
| 6 | https://www.easel.ly/ | 68 |
| 7 | https://elearninginfographics.com/ | 59 |
| 8 | https://www.visualistan.com/ | 58 |
| 9 | https://www.infographicjournal.com/ | 56 |
| 10 | https://ilovecharts.tumblr.com/ | 52 |
Free Infographic Submission Sites
| S. No. | Free Infographic Submission Websites | Website DA |
|---|---|---|
| 1 | https://www.infographicsarchive.com/ | 53 |
| 2 | https://www.graphs.net/ | 49 |
| 3 | https://www.infographicszone.com/ | 48 |
| 4 | https://www.infographicportal.com/ | 46 |
| 5 | https://www.infographiclist.com/ | 45 |
| 6 | https://www.infographicbee.com/ | 41 |
| 7 | https://www.loveinfographics.com/ | 40 |
| 8 | https://www.infographicsposters.com/ | 37 |
| 9 | https://www.infographicsite.com/ | 37 |
| 10 | https://www.infocarnivore.com/ | 35 |
| 11 | https://www.onlyinfographic.com/ | 34 |
| 12 | http://www.infographicpost.com/ | 30 |
| 13 | https://www.cooldailyinfographics.com/ | 28 |
| 14 | https://www.infographicplaza.com/ | 27 |
| 15 | https://www.infographicsking.com/ | 25 |
| 16 | https://www.infographicdatabase.com/ | 24 |
| 17 | https://www.videoinfographic.com/ | 24 |
| 18 | https://www.infographicreviews.com/ | 16 |
List of Free SEO Infographic Submission Sites
| S. No. | SEO Infographic Submission Websites | Website DA |
|---|---|---|
| 1 | https://www.scribd.com/ | 94 |
| 2 | https://www.4shared.com/ | 94 |
| 3 | https://www.imgur.com/ | 92 |
| 4 | https://www.deviantart.com/ | 90 |
| 5 | https://www.pearltrees.com/ | 86 |
| 6 | https://www.ello.co/ | 86 |
| 7 | https://www.500px.com/ | 85 |
| 8 | https://www.screencast.com/ | 82 |
| 9 | https://www.smugmug.com/ | 79 |
| 10 | https://www.weheartit.com/ | 78 |
| 11 | https://www.23hq.com/ | 60 |
| 12 | https://www.imgbb.com/ | 80 |
| 13 | http://www.omginfographics.com/ | 18 |
| 14 | https://www.discoverinfographics.com/ | 17 |
How to Create Infographics?
Designing captivating infographics is a mixture of visual design, effective storytelling, etc. The following guide shows how to create impactful, step-by-step infographics:
Define Your Objective:
Clearly outline the infographic’s purpose. Are you presenting data, explaining a process, or comparing information? Understanding your goal guides content and design choices.
Identify Your Target Audience:
Tailor the infographic to resonate with your specific audience. Consider their preferences, interests, and the level of detail they require.
Gather Relevant Data:
Collect accurate, up-to-date data supporting your objective. Ensure the information is credible and adds value to your audience.
Choose The Right Infographic Type:
Select an infographic type aligning with your content and goals, such as statistical, informational, process, or comparison infographics.
Create a Visual Hierarchy:
For the viewer direction is provided by having a clear visual hierarchy, one ought to put essential information with significant precision by using size,colour and placement for hiararchy.
Design with Consistency:
Maintain the same design theme always. This involves employing an identical color palette, fonts, and graphic elements that are consistent to create a nice-looking and professional design.
Choose Appropriate Fonts and Colors:
Opt for legible fonts that complement your brand or topic. Use a limited color palette enhancing readability and aligning with the mood or message.
Utilize Icons and Graphics:
Incorporate relevant icons and graphics for visual representation. Choose visuals enhancing understanding and adding appeal.
Craft a Compelling Headline:
Create a captivating headline succinctly conveying the main message. Use a font size and style encouraging viewer engagement.
Tell a Story:
Organize your content in a logical manner. The viewer should be led from the beginning to the end. Infographics should contain some narrative element which will facilitate ease of comprehension.
Keep It Simple:
Avoid clutter and unnecessary details. Effective infographics present information concisely. Aim for simplicity without sacrificing clarity.
Test and Revise:
Before finalizing, gather feedback from colleagues or target audience members. Use this input to make improvements and ensure effective communication.
Export in High Quality:
When satisfied with your design, export the infographic in a high-resolution format, maintaining clarity and visual appeal when shared or published.
How to Submit Infographics?
Effectively submitting infographics involves a strategic process to maximize their reach and impact. Here’s a comprehensive guide on how to submit infographics:
Identify Relevant Platforms:
Research and pinpoint platforms aligning with your infographic’s content to target relevant audience.
These may encompass general content-sharing sites, niche-specific directories, and social media channels emphasizing visual content.
Review Submission Guidelines:
Before submitting, meticulously examine the guidelines of each platform.
Ensure your infographic aligns with specified requirements regarding file format, size, and content relevance. Adhering to guidelines heightens the likelihood of acceptance.
Create a Catchy Description:
Craft a compelling, concise description for your infographic. Clearly communicate its purpose, key takeaways, and any additional context enhancing its value.
A well-crafted description can pique interest and encourage engagement.
Optimize for Search Engines:
To make sure that the infographic is easily found through a search engine, include important keywords about it in both the title and description. This way more people can see your creative work.
Utilize Social Media:
Leverage your social media channels to share the infographic.
Post it on platforms like Twitter, Facebook, LinkedIn, and Pinterest, providing a link back to the original submission or your website. Social media amplification significantly enhances visibility.
Engage with Influencers:
Locate the top reviewers or managers in your field then approach them; they could help widen the scope of your infographic to more distinct and larger audience space.
Email Outreach:
Consider reaching out to relevant websites or blogs in your industry. Send personalized emails introducing your infographic and explaining how it could be valuable to their audience.
Building relationships can lead to featured placements.
Submit to Infographic Directories:
Explore above dedicated infographic directories specializing in visual content. Submitting to these directories increases the chances of your infographic being discovered by individuals actively seeking visual content.
Track Performance:
Monitor the infographic’s performance after submission. Track metrics such as views, shares, and backlinks. Analyzing these metrics provides insights into the effectiveness of your submission strategy.
Repurpose Content:
Consider repurposing your infographic into different formats, such as slide presentations or video content. This allows you to submit your content to additional platforms and broadens its exposure.
Stay Consistent:
Maintain a consistent submission schedule to keep your audience engaged. Regularly sharing infographics ensures continuous visibility and establishes your presence in the visual content landscape.
Explore Paid Promotion:
If your budget allows, consider paid promotion on social media or content discovery platforms. Paid promotion can provide a significant boost in visibility and engagement.
The Key Benefits of Infographic Submission
Infographic submission is integral to a robust digital marketing strategy, offering numerous key benefits. Here, I’m narrating the primary advantages:
1. Enhanced Visibility and Reach
Amplifying content visibility, infographic submission strategically shares visual content on pertinent online platforms. This targeted approach increases the probability of reaching a broader audience.
2. Backlink Generation for SEO
Submissions to reputable platforms yield valuable backlinks, crucial for SEO. These backlinks enhance domain authority, contributing to enhanced search engine rankings and support overall SEO performance.
3. Increased Brand Awareness
Engaging in infographic submission broadens brand exposure. Visually compelling infographics shared across diverse platforms cultivate brand awareness and affirm expertise within the industry or niche.
4. Social Media Amplification
Highly shareable on social media, infographics submitted to these channels encourage amplification through increased likes, shares, and comments. This engagement not only broadens the audience but also signals positively to search engines.
5. Targeted Audience Engagement
Tailoring content to specific platforms and audiences, infographic submission facilitates engagement with a focused audience interested in the presented information.
6. Improved User Experience
Visually appealing infographics simplify complex information, enhancing the overall user experience. Users are encouraged to spend more time on content, contributing to lower bounce rates and increased on-page time.
7. Content Repurposing Opportunities
Infographic submissions create opportunities for content repurposing. Successful infographics can be adapted into various formats such as slide decks, videos, or social media posts, extending content life and reach.
8. Establishing Thought Leadership
Regular submission of high-quality infographics positions a brand as a thought leader. Consistently providing valuable insights creates trust among the audience, reinforcing expertise within the industry.
9. Measurable Performance Metrics
Infographic submission platforms typically provide analytics and performance metrics. Tracking views, shares, and backlinks enables an assessment of submission effectiveness, facilitating data-driven adjustments for future strategies.
10. Diversification of Content Strategy
Adding variety to the overall content strategy, infographic submission caters to diverse audience preferences. This aligns with search engine algorithms that favor a mix of content types.
FAQ(s) about Infographic Submission Sites
A comprehensive infographic integrates key components, each serving a distinct purpose:
Captivating Title: Attractive title will seize attention and communicate the infographic’s themes which enables setting the stage for viewer engagement.
Informative Content: This component articulates data in a clear, concise, and engaging manner, ensuring the audience comprehends the information presented.
Visual Elements: Graphics, charts, and images are employed to enhance understanding, providing a visually appealing context to the data being conveyed.
Branding: Inclusion of a logo and consistent branding elements reinforces the infographic’s association with a specific brand, fostering brand recognition.
Call to Action: The infographic concludes with a call to action, motivating further engagement.
To comprehend the inner workings of infographic submission sites, it is crucial to delve into the behind-the-scenes processes. Typically, these platforms follow a systematic approach that encompasses.
Here are the operational dynamics of infographic submission sites:
1. Registration: Initiate the process by actively creating an account on the submission site.
2. Guidelines: Acquaint yourself with the submission guidelines provided by the platform.
3. Uploading: Navigate through the platform’s prescribed procedure to upload your infographic.
4. Review: Some submission sites implement a review process before publishing the infographic. During this stage, the platform assesses the content’s alignment with guidelines and overall quality, ensuring it meets the platform’s standards.
Effectively optimizing infographics for search engines encompasses specific strategies, which include:
1. Keyword Research: Identify pertinent keywords and actively integrate them into both titles and descriptions.
2. Image Optimization: Optimize images by compressing them to facilitate faster loading times. Additionally, include descriptive alt text for images, contributing to improved accessibility and search engine recognition.
3. Shareability: Actively encourage social sharing to amplify the infographic’s online visibility. Engaging users to share the content on various social platforms contributes to broader exposure and increased reach.
The evolution of infographics unveils a rich history and intriguing details:
Early Origins:
The integration of visual elements to convey information has roots that span centuries. Visual storytelling has been a timeless method of communication.
Digital Revolution:
With the ascent of digital media, infographics witnessed a remarkable surge in popularity. The digital revolution facilitated the creation, distribution, and accessibility of infographics on a global scale.
Versatility:
Infographics exhibit remarkable versatility, finding applications across diverse fields—from journalism to education. Their adaptability underscores their effectiveness as a communication tool in various professional domains.
Conclusion
I hope this guide has clarified the process of infographic submission from start to finish.
In summary, infographic submission strategically disseminates visually compelling content, enhancing its reach and impact. This process allows creators to share insights and messages with a broader audience across the digital landscape.

